

Introduction
Some time ago, Microsoft released a full-featured Chart
Control for the .NET Framework 3.5. The Chart Control
provides a wide range of capabilities for both ASP.NET and
WinForm applications. In this article, I will focus
primarily on ASP.NET capabilities; however, many of these
techniques will work in WinForm applications as well.
To get started, we need to download the Chart Control
installers from Microsoft. Here are the 3 packages to
download and install:
- Microsoft Chart Control for .Net 3.5 SP1
- Microsoft Chart Control Add-on for Microsoft Visual Studio 2008
- Optional Documentation: Microsoft Chart Control Documentation
- In addition, Microsoft has created a Samples Environment which I
highly recommend downloading as it provides a great way to see all of the features of the controls.
After downloading and installing the chart control we
can start developing using the new control. First we
will stat with a blank ASP.NET Application. Open up
the default.aspx page in design mode. In the Toolbox,
you should find a new Chart control under the Data tab as
shown in the figure below:
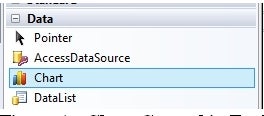
Figure 1 – Chart Control in Toolbox
Double click on the Chart control to add it to the page
or Drag and Drop it. After adding the control to the
page, you should see an empty chart as shown below:
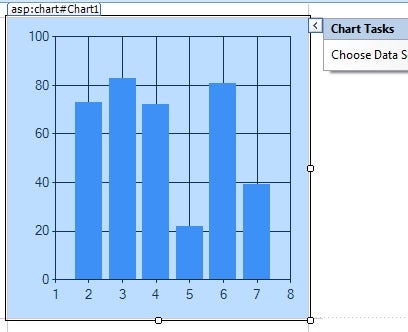
Figure2 – New Chart
As you can see on the right, the chart is ready to be
bound to a data source; however, before we jump into data
binding we need to cover some of the basic chart
features. The area where the chart is displayed is
called the chart area. As you would expect, the chart
area can be styled with background, colors, etc. The
important thing to note is that a single chart can have more
than one chart area. Chart areas are essentially
independent charts within the chart control. Within
the chart control, chart areas display mode (2D/3D),
placement and z-order can be controlled. Within each
chart area is one or more data series or just simply
series. Each series has a chart type (bar, pie, etc),
styling, and a series of data points. Each data point
has an X value and one or more Y values.
Data Binding
Next we can jump in and bind the chart to a
database. For this example, I’ve created a simple
SQL table called SalesData with 3 columns in it ID, Date and
TotalSales. I will also create an Entity Data Model
and add in the single table within the database. Next
we will use bind the chart control using the entity data
binding. Then we use smart tag on the chart control
and choose a new data source. Select Entity from the
possible data source types and click Ok. Choose the
named connection created for the Entity Data Model just
created and click Next. Next choose SalesData from the
EntitySetName drop down. Then select only the fields
needed for data binding, in this case we only need the Date
and TotalSales fields. Click Finish to complete the
data source wizard. At this point, if yo were to run
the project you would receive a blank page. The reason
the chart does not display is that while we have data bound
it, we have not given the series field to bind to. To
do this we need to first view the properties for the chart
control. Specifically, we need to modify the Series
property. Click on the elipse to access the Series
Collection Editor. You should notice that a single
series called “Series1” is created by default with
a new chart control. In the right pane, scroll down to
the data binding properties XValueMember and
YValueMember. For our data we will use the Date and
the XValueMember and TotalSales for the YValueMember as
shown below:
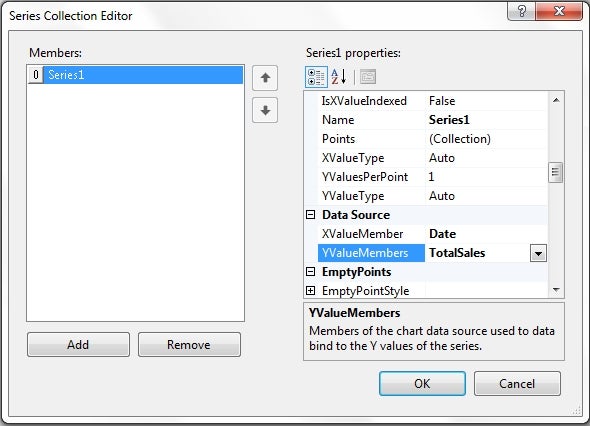
Figure 3 – Series Collection Editor
If you run the project at this point you should receive
data; however, it is not a very attractive chart. Lets
take advantage of 3D with this chart. We can enable 3D
for this chart by accessing the ChartAreas property on the
chart control. Again a ChartArea1 is created by
default. Locate the property called (Enable3D) in the
right pane, change the value from false to true and press
Ok. The preview should change to reflect the change to
3D. Next, we can change the chart type on the series
from Column to Spline. If you go ahead and run
the project you should have a slightly more interesting
chart as show in the figure below:

Figure 4 – 3D Databound Chart
Titles, Axis Titles, Legend
Next we should add a Title to the chart. This is
done by creating a title using the Titles property on the
chart control. Similar to the series and chart area, a
Title Colllection Editor is used to facility the
process. Add a title by clicking on the Add
button. Then locate the (Title) property in the right
pane. Give your chart a title, change the styling if
you so choose and click Ok. As you may have already
guessed, you may add as many titles as needed for your
chart. To create a Legend for the chart we use the
property Legend on the chart by clicking on the
elipse. Using the Legend Collection Editor we can add
one or more Legends. Simply clicking the add button
will create and place a legend on the right side of the
chart. You can adjust the styling and position of the
legend using this screen.
The Axis Titles are similar to the chart Titles;
however, Axis Titles are specific to a Chart Area rather
than the chart control. Under the Chart Area editor,
select ChartArea1 and edit the Axis property to specify
primary and secondary titles for the X and Y axis.
Adding data without Data Binding
Unlike many 3rd party chart controls, the Microsoft
Chart Control is actually very easy to populate in code
behind. The following code snippet shows just how easy
it is to add data points to the Series1 used above.
However, you will need to remove data binding from the chart
to prevent conflicts.
                  Chart1.Series["Series1"].Points.AddXY(1, 15000);


                  Chart1.Series["Series1"].Points.AddXY(2, 16000);


                  Chart1.Series["Series1"].Points.AddXY(3, 13000);


                  Chart1.Series["Series1"].Points.AddXY(4, 18000);
The above snippet uses the AddXY method on the series
object to add 4 data points to the series. There are
several different versions of the AddXY method which allows
for passing in objects for X (numbers, dates, string) and
for handling multiple Y values.
Conclusion
Above, we went through the basics of adding the control
to your project, performing the basic configuration and
populating it with data. As you can see, the chart
control covers many of the basics necessary for
charting. However, this article has just
scratched the surface of all of the functionlity included
within the chart control. Some of the advanced
features which we did not touch on is the ASP.NET AJAX integration,
real-time data, drill downs, etc. Please look for a
future article from me regarding these advanced features of
the Microsoft Chart Control for the .NET Framework 3.5.