

Debugging in Visual Studio is a wonderful thing. You can use the tools built into the debugger to drill into the values of objects and their member variables easily. But even wonderful things can be improved, and that’s exactly what Microsoft has done with the introduction of debugger visualizers in Visual Studio 2005. Debugger visualizers allow you to provide a custom user interface for the display of particular classes of data when your program is in debug mode. While there are some complex use cases for this, you can actually derive considerable benefit from very simple debugger visualizers – ones that take ten minutes or less to build. Here’s how.
The Problem of Objects
Visual Studio knows how to drill into your custom objects, but by default it doesn’t know much more than that. Suppose, for example, you’ve built a task-tracking application with a very simple Task class:
class Task
{
   private string _TaskName;
   public string TaskName
   {
      get
      {
         return _TaskName;
      }
      set
      {
         _TaskName = value;
      }
   }

   private DateTime _Due;
   public DateTime Due
   {
      get
      {
         return _Due;
      }
      set
      {
         _Due = value;
      }
   }

   private string _Description;
   public string Description
   {
      get
       {
         return _Description;
      }
      set
      {
         _Description = value;
      }
   }

   public void Save()
   {
      // code to save the object goes here
   }
}
Somewhere in your application, you’re creating and saving Task objects. If you go into debug mode, you can get a display similar to that shown in Figure 1.
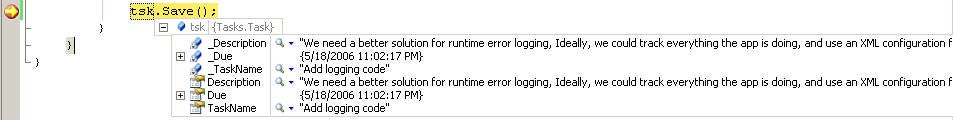
The information is all there, but it’s not really well formatted. Private and public members are jumbled together, and long text strings stretch out to the right until stopped by the size of your screen. Let’s see how you can do better.
Creating the Debugger Visualizer
To make debugging within this particular application easier, I’m going to build a single-purpose debugger visualizer right into the application. This will require adding one class and one form. To get started, right-click on the project and select Add, New Item. This opens up the dialog box shown in Figure 2. As you can see, C# delivers a Debugger Visualizer item type, which makes this whole process almost trivial.

The debugger visualizer skeleton includes clear instructions on what to do to make it work. First, I have to decorate my Task class to indicate that it can be visualized by the visualizer that I just created. Note that the class also has to be marked serializable; that’s how its data gets passed to the visualizer:
[DebuggerVisualizer(typeof(TaskDebuggerVisualizer))]
[Serializable]
class Task
The next step is to create the user interface that I want to use to display instances of the Task class. In this case, I opted for a simple Windows form, containing two TextBox controls and a DateTimePicker control. To make life simpler, I went into the generated code for the form and changed the visibility of those controls to public.
Form in hand, the only remaining task was to modify the Show method of the debugger visualizer class. This method gets handed the object being debugged, and displays it. Here’s my modified code:
protected override void Show(IDialogVisualizerService windowService,
   IVisualizerObjectProvider objectProvider)
{
   Task data = (Task)objectProvider.GetObject();

   using (TaskDebuggerForm displayForm = new TaskDebuggerForm())
   {
      displayForm.txtTask.Text = data.TaskName;
      displayForm.dtpDue.Value = data.Due;
      displayForm.txtDescription.Text = data.Description;
      windowService.ShowDialog(displayForm);
   }
}
The Debugger Visualizer in Action
Believe it or not, that’s all that’s needed to improve the debugging experience. Now, with the code in debug mode and a Task object in scope, Visual Studio knows that my custom debugger visualizer is available, and it shows a little magnifying glass icon next to the variable data type when I hover my mouse over the variable. CLicking the magnifying glass invokes my debugger visualizer, opening the form and passing in the data, as shown in Figure 3.

Next Steps
This particular debugger visualizer is private to this project; in effect, it’s a throwaway. The bar to creating such a tool is so low in Visual Studio 2005 that it’s feasible to build one any time you’ve got a class that would benefit from its own dedicated display in debug mode, even if you’re only going to be dealing with it for an hour or two.
You may ultimately create a debugger visualizer that’s not a throwaway. Perhaps it’s for a utility class that you reuse in many projects, or you’ve come up with a neat visualization for some common type such as a DataSet or an XmlDocument. In that case, you’ll want to move your code to its own class library, and compile it independently. Then just copy the DLL to either Microsoft Visual Studio 8\Common7\Packages\Debugger\Visualizers or My Documents\Visual Studio 2005\Visualizers. Restart Visual Studio, and your new visualizer will be available to every project that you load.
About the Author
Mike Gunderloy is the author of over 20 books and numerous articles on development topics, and the lead developer for Larkware. Check out his latest books, Coder to Developer and Developer to Designer, both from Sybex. When he’s not writing code, Mike putters in the garden on his farm in eastern Washington state.